The PSA Correlations Page allows you to define correlations between sampled parameters included in the probabilistic sensitivity analysis.
The PSA Page is divided into three tabs: Inputs, Correlations, and Results. To access the PSA Inputs tab, click on the PSA icon ![]() in the Navigation Sidebar on the left side of your screen. Then click on the
in the Navigation Sidebar on the left side of your screen. Then click on the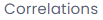 icon in the popup menu that appears to the right of the Navigation Sidebar.
Correlations
The PSA Correlations Page provides a space to designate correlations between sampled parameters by specifying a correlation matrix. To add correlated variables, click ‘Manage Correlated Variables’, check the parameters you want to specify as correlated in the popup menu, and click ‘OK’.
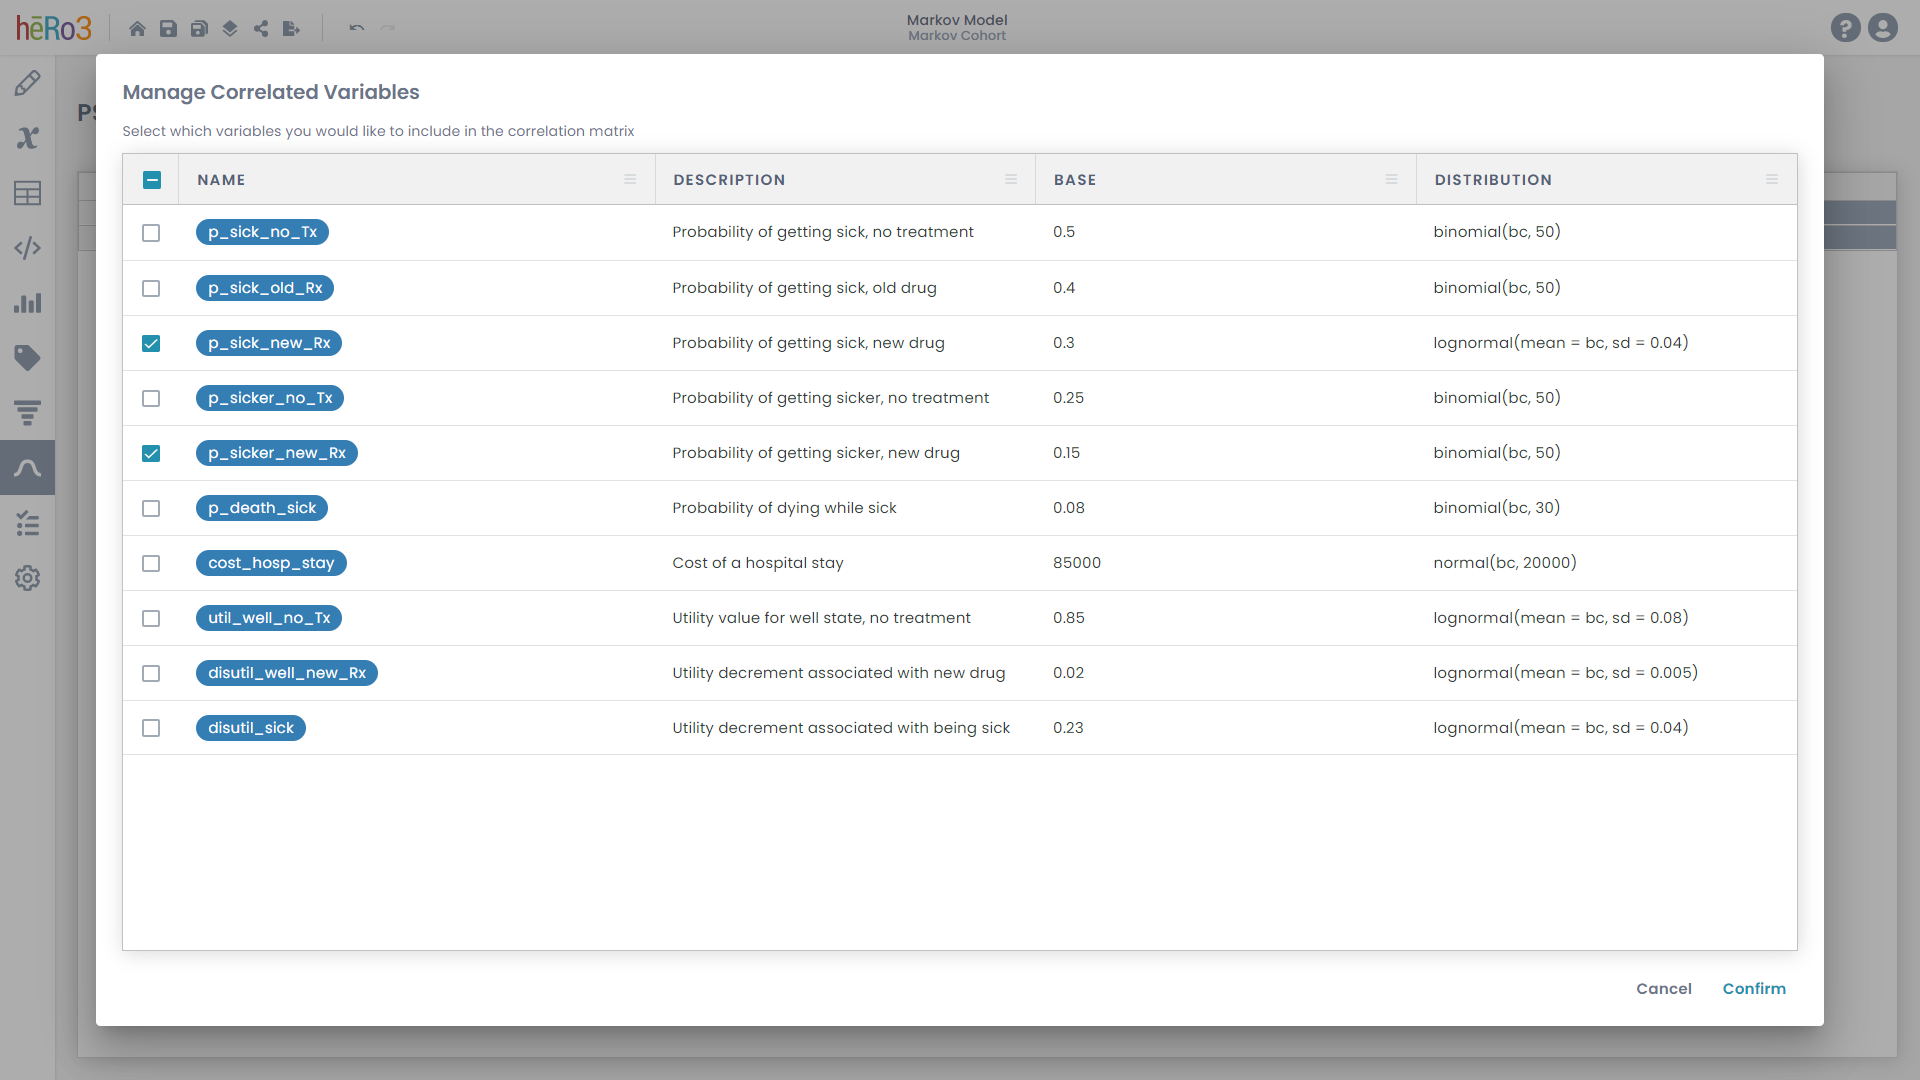
The selected variables will be displayed in a lower diagonal matrix, where each cell represents the pairwise correlation between the given variables. You need to specify a correlation coefficient, between 0 and 1, for each such cell. A value of 0 means that two variables are uncorrelated; a value of 1 means that they are perfectly correlated.
TIP: Users can filter and sort (individually or in combination) on any of the column headers to organize and temporarily limit their view to items of interest. Users can also copy and paste to quickly populate distribution inputs. You may find descriptions of additional functionality available on this page, and other similarly structured pages, here.