Introduction
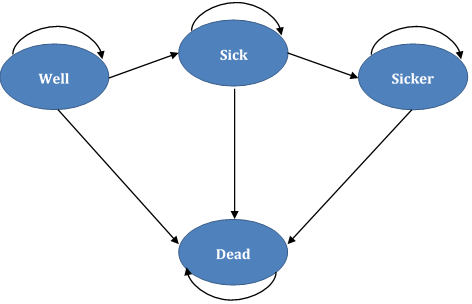
In this tutorial, we will build a simple 3-state Markov cohort model in hēRo3. We will compare three strategies with this model: a new treatment for a particular disease (‘New_Rx’), an existing treatment for a particular disease (‘Old_Rx’), and a scenario depicting its natural history without treatment (‘No_Tx’). In this model, patients are assumed to be in one of four mutually exclusive health states: ‘Well’, ‘Sick’, ‘Sicker’, or ‘Dead’. All patients begin the model in the ‘Well’ state, and in every cycle of the model, they can either remain in the ‘Well’ state, transit to the ‘Sick’ state, or die (ie, move to the ‘Dead’ state). Patients who enter the ‘Sick’ state in a given cycle of the model may remain in that state in subsequent cycles, transition to the ‘Sicker’ state, or die; they are assumed never to return to the ‘Well’ state. Patients in the ‘Sicker’ state may remain in the ‘Sicker’ state in subsequent cycles or die. Patients in the ‘Sicker’ state may not return to the ‘Sick’ state nor to the ‘Well’ state. We can depict this model as follows:
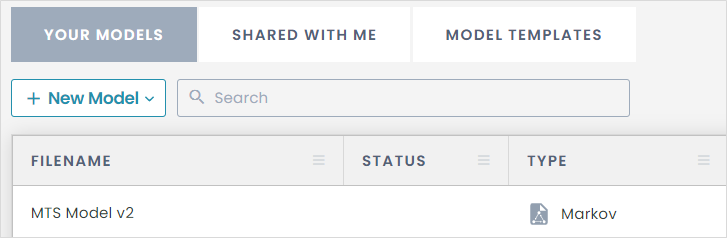
Creating a New Model
To begin building this new Markov state-transition model in hēRo3, click the ‘Markov Cohort’ button in the ‘New Model’ section at the top of the hēRo3 Workspace, as shown below. You will be taken to the Settings page in the hēRo3 Model Editor.
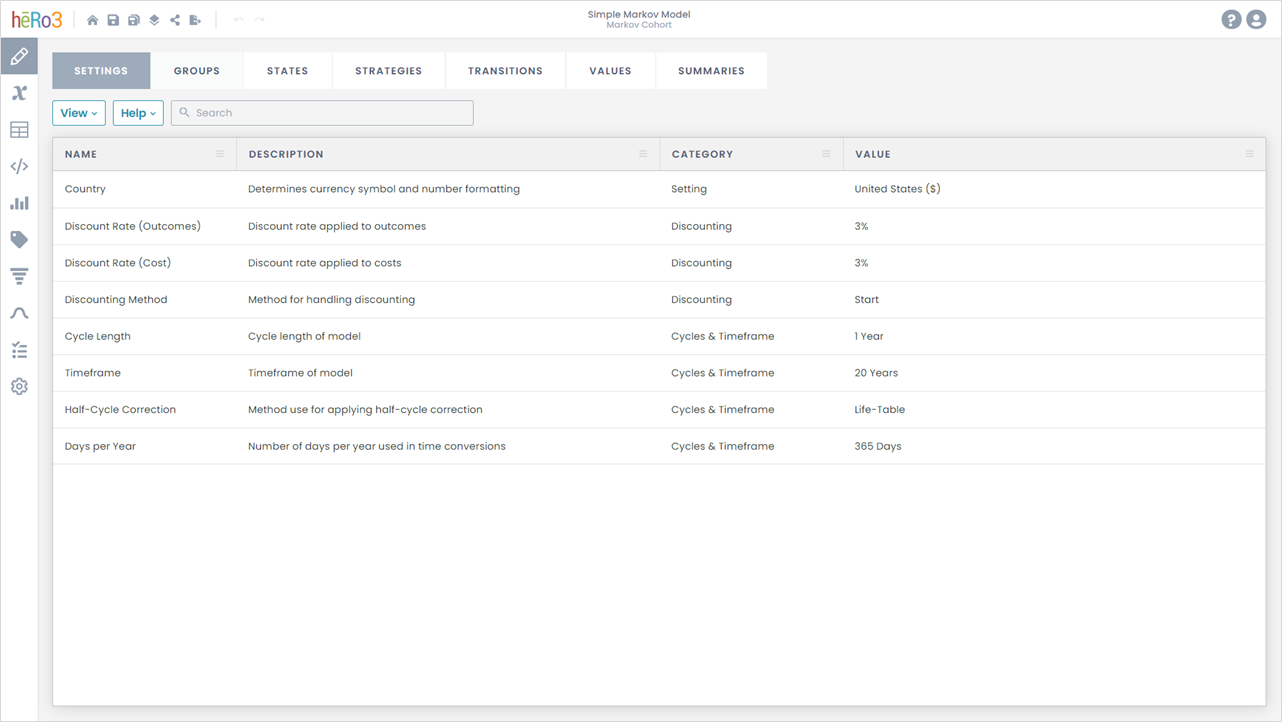
Settings
The Settings page in the hēRo3 Model Editor is the first stop on the hēRo3 Subway, and it’s where you begin the process of building a new model. Here, you can specify the country of interest (which determines how hēRo3 displays costs), the discount rates that should be used for outcomes and costs (they can differ if you like), the desired length of cycles in your model, the timeframe over which you would like your model to run, and the half-cycle correction method that you want to use. For this tutorial, we will specify the United States as the setting of interest, we will select annual discount rates of 3% for both outcomes and costs, and we will assume a discount rate consistent with the start time of a cycle, by selecting the ‘Start’ method for discounting. We will use a cycle length of one year, and run the model for 20 years. Finally, we will select the ‘Life-Table’ method of half-cycle correction, which will use the average of state membership at the start and end of each cycle as the estimate of state membership in that cycle.
Groups
The second stop on the hēRo3 Subway in the hēRo3 Model Editor is the Groups page. The Groups page is optional and should be completed only if you would like to incorporate heterogeneity into your model population. For this tutorial, we will have two groups: ‘Young’ and ‘Old’. Add groups using the ‘Add’ button and selecting the ‘Group’ option. The two groups will be weighted equally, so the ‘Weight’ column should be populated with the same value for each group (ex. 0.5 and 0.5, 1 and 1).

States
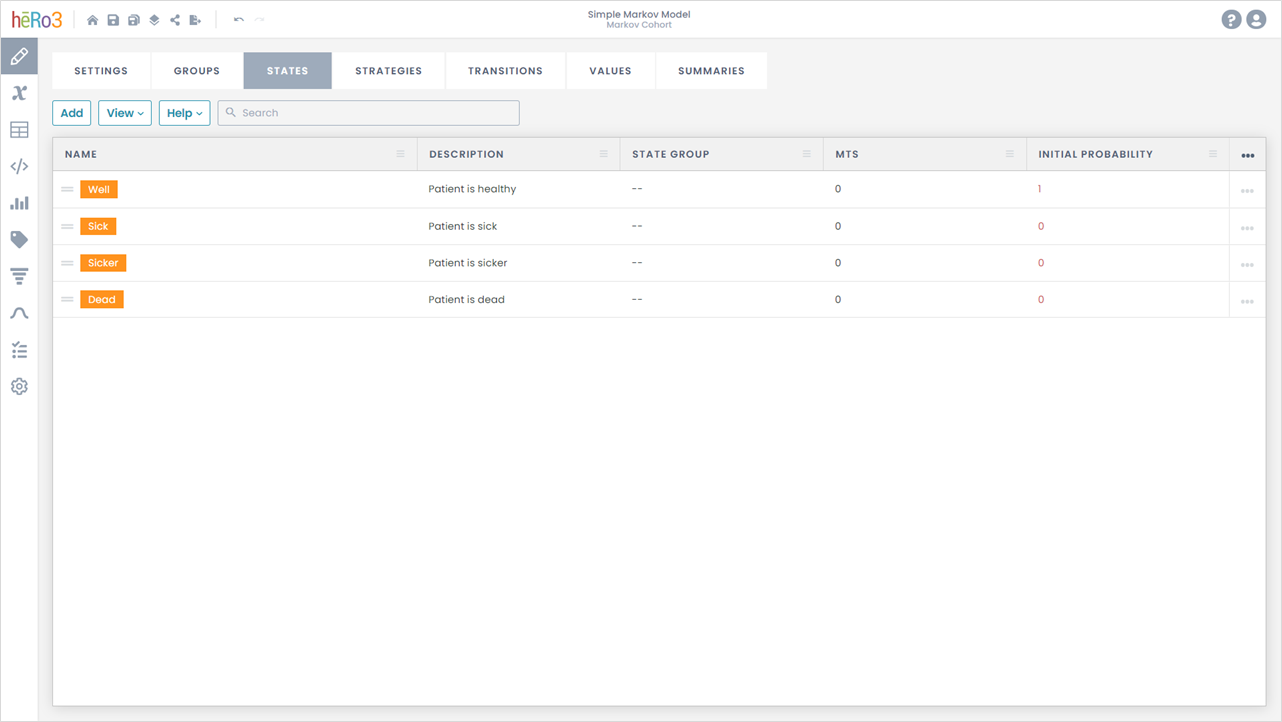
The third stop on the hēRo3 Subway in the hēRo3 Model Editor is the States page, where you define the states of your model. For this particular model, we will create four health states: ‘Well’, ‘Sick’, ‘Sicker’, and ‘Dead’. To create a new state to include in your model, click on the ‘Add’ button. To ensure that patients begin the model in the ‘Well’ state, enter ‘1’ as the initial probability for the well state, and enter ‘0’ for every other state.
Strategies
The fourth stop on the hēRo3 Subway in the hēRo3 Model Editor is the Strategies page, where you define the strategies you want to consider in your model. In this particular model, we will create three strategies: ‘New_Rx’, ‘Old_Rx’, and ‘No_Tx’. To create a new strategy, click on the ‘Add’ button. The check marks next to each strategy allow you to specify whether you want to include a particular strategy in a given model run. At least two strategies must be checked for a hēRo3 model to run. You may enter as many strategies as you like on this page.

Tables
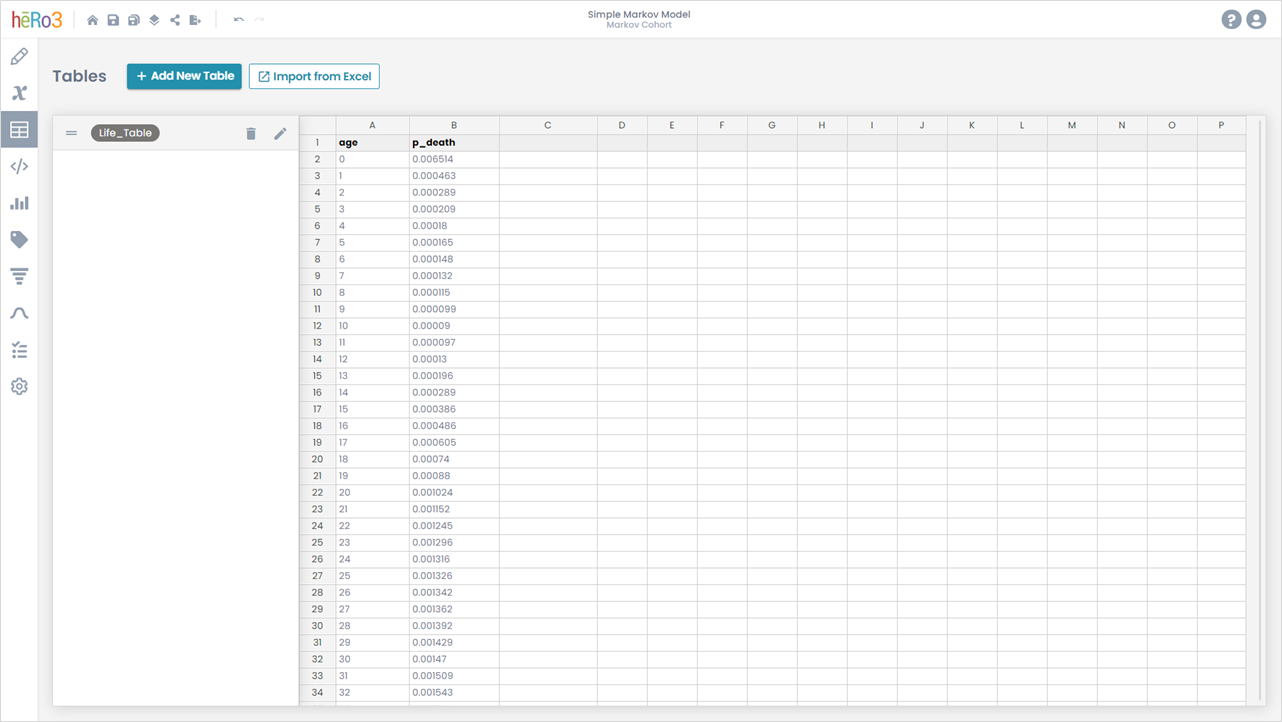
Before moving to the fifth stop on the hēRo3 Subway in the hēRo3 Model Editor, we will first take a detour to visit the hēRo3 Tables page. For this tutorial, we will only have one table. To add a table, click ‘Add New Table’, assign your table a name, and a description and copy and paste in a life table that includes one column for age (‘age’) and one column for probability of death (‘p_death’). The Tables page can be used for general population life tables, Kaplan-Meier data, and any other type of data (ex. costs) you would like to organize into a table. The Tables page can be referenced on the Parameters page. Please note that no individual patient data should ever be entered into the Tables page, or any other hēRo3 page.
Parameters
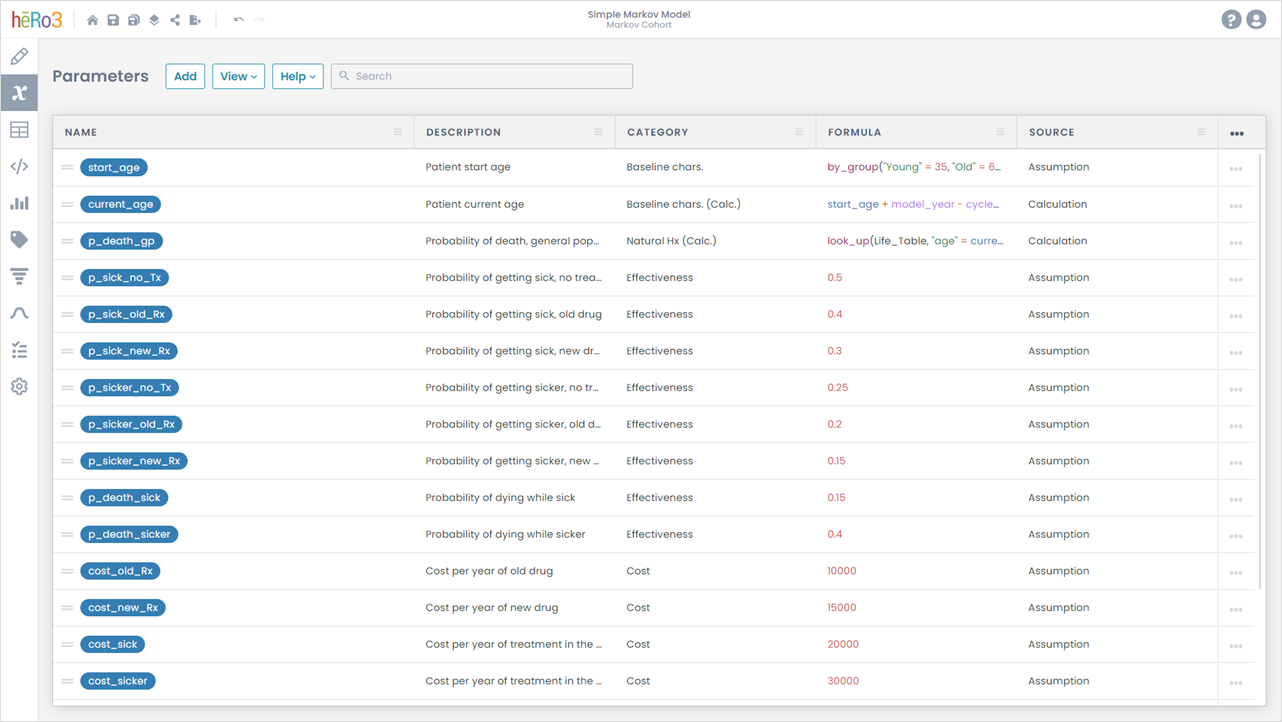
Before moving to the fifth stop on the hēRo3 Subway in the hēRo3 Model Editor, we will take a second detour to visit the hēRo3 Parameters page. The Parameters page is where you define all of the variables that you want to use in your model. Variables can be either inputs or intermediate calculations. You specify the value that every variable takes on as an R expression in the Formula column on this page. A variable's value can be either a constant or a formula. Once you define a variable, you can reference it elsewhere in your model. Variables are easy to spot in hēRo3, as they are always represented as a blue pill. To create a new variable, click on the 'Add' button. In most models, you need to define variables for transition probabilities, health-state utilities, and costs, as shown in the image below.
Transitions
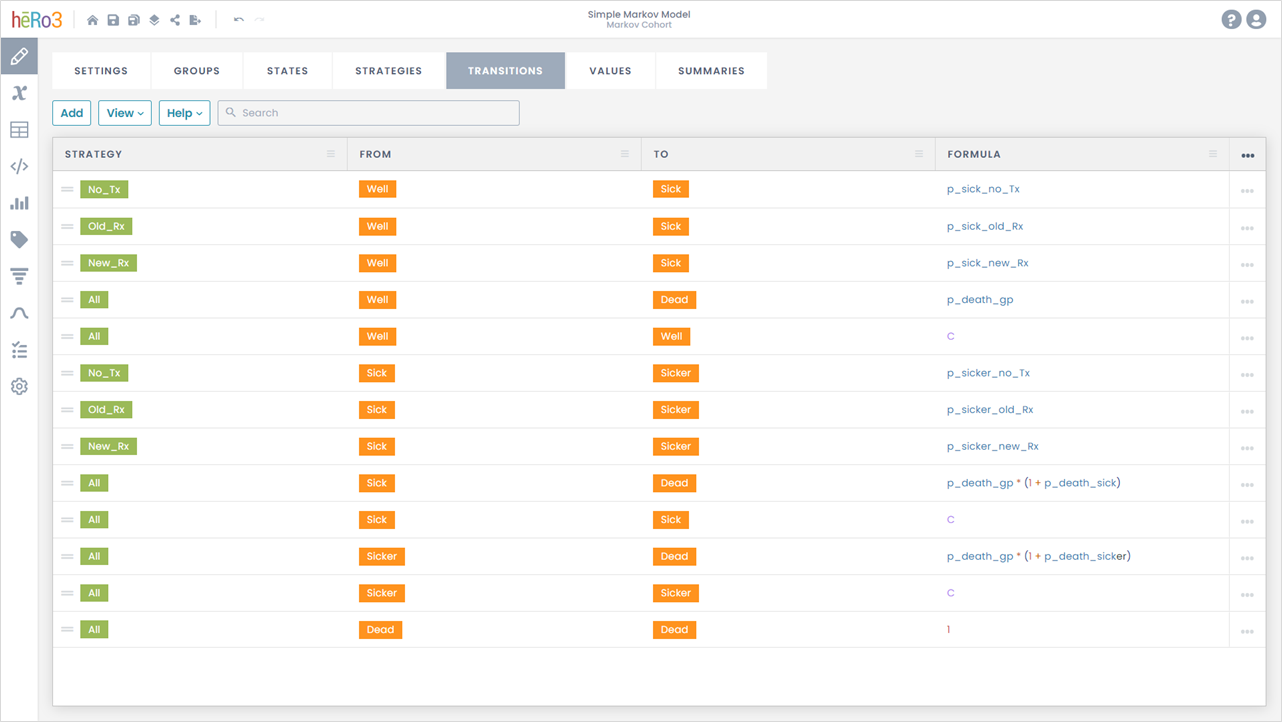
Now that we have defined the variables that we want to use in our model, we can return to the fifth stop on the hēRo3 Subway in the hēRo3 Model Editor, which is the Transitions page. When you are building a Markov cohort model, the Transitions page is where you define the transition matrices for each strategy in your model. In hēRo3, you define transition matrices using a so-called ‘long-form’ table, where each row represents a cell in the transition matrix for one or more strategies, and the value in the formula column is an R expression representing the transition probability. You only need to define transition probabilities that are possible (eg, you do not need to specify the probability of transition from Dead → Well); if you do not enter a transition probability between two states, hēRo3 assumes that it’s value is zero. For this particular model, this means that we only need to define the following transitions:
- Well → Well
- Well → Sick
- Well → Dead
- Sick → Sick
- Sick → Sicker
- Sick → Dead
- Sicker → Sicker
- Sicker → Dead
- Dead → Dead
In the Formula column, you reference transition probabilities that you created on the Parameters page. Once you have described the probabilities of transitioning from a particular state to all other states, and you want to specify the probability of staying in the starting state, you can simply use the keyword, 'C', which stands for ‘complement’ in hēRo3. When you specify a transition probability as ‘C’, hēRo3 automatically calculates its value as one minus all other probabilities of transition from that state, ensuring that the sum of all your probabilities always equals one.
Values
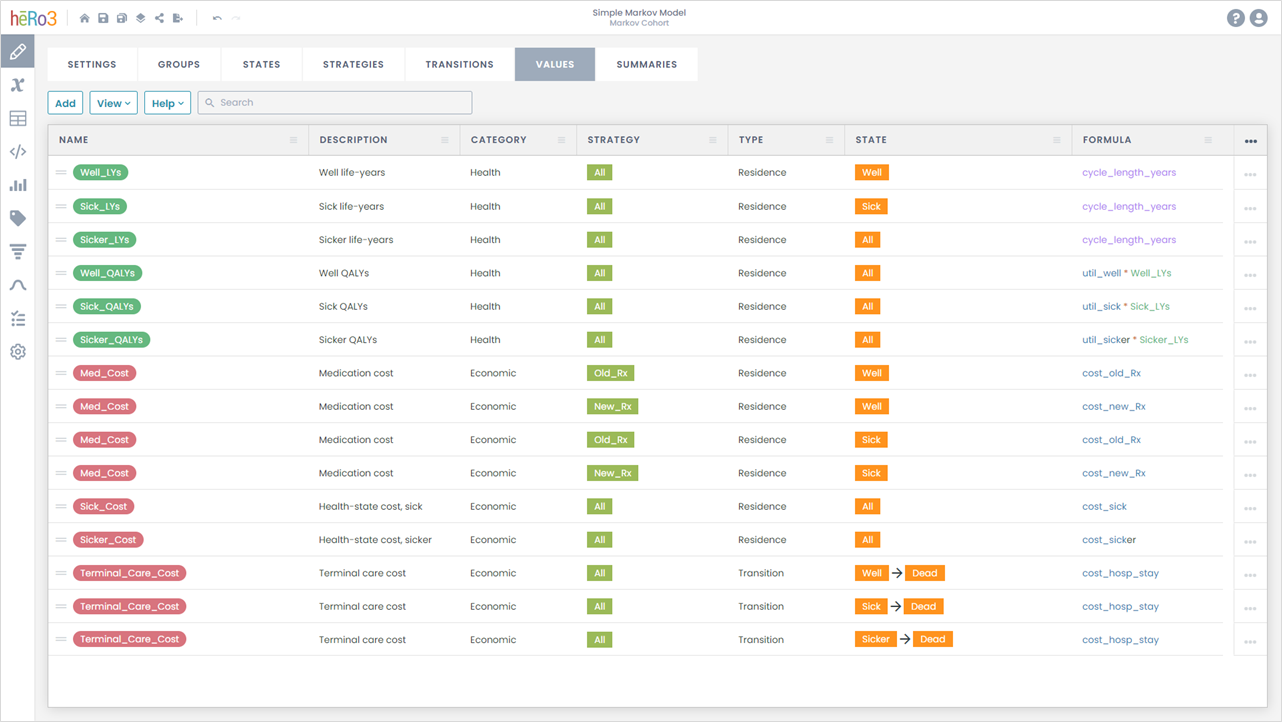
The sixth stop on the hēRo3 Subway in the hēRo3 Model Editor is the Values page. Values on the Values page must be categorized as either health values or economic values.
Health values and economic values are the line-item outcomes and costs that you want to account for in your model.
For the model that we are building in this example, we want to include life-years and quality-adjusted life-years (QALYs) by health state. We need to designate a name for each health value, provide a description for it, assign a type (ie, state residence, state transition, or model start), and describe the different ways in which it can accrue from an accounting standpoint. Each entry must be associated with a given health state (or all health states) or a state transition or model start, a given strategy (or all strategies), and a formula representing the amount of this particular outcome that accrues in each cycle.
Values may need multiple rows per value. Consider, for example, the economic value, ‘Med_Cost’, which represents drug costs accrued in the ‘well’ and ‘sick’ state for two drug therapy strategies (‘New_Rx’ and ‘Old_Rx’). Since ‘New_Rx’, ‘Old_Rx’, and ‘No_Tx’ each have different drug costs, we need to specify two entries (ie, one for each strategy) for each state incurring this cost, with each referencing the corresponding's strategy's drug cost. To add a new value, click the ‘Add’ button. To add new entry within an existing value, click the ‘Add’ button and assign the same name as is assigned to the value of which you would like another entry.
We also want to include health-state costs and a terminal care cost in this model. For this tutorial, we want to define one-time costs of terminal care as being associated with transitions from the ‘Sick’ state to the ‘Dead’ state and from the ‘Sicker’ state to the ‘Dead’ state. You can do this in hēRo3 by selecting ‘transition’ in the type column, which will give you the option to select a ‘To’ state and a ‘From’ state. Select ‘Sick’ as the ‘From’ state and ‘Dead’ as the ‘To’ state, then repeat for ‘Sicker’ to ‘Dead’.
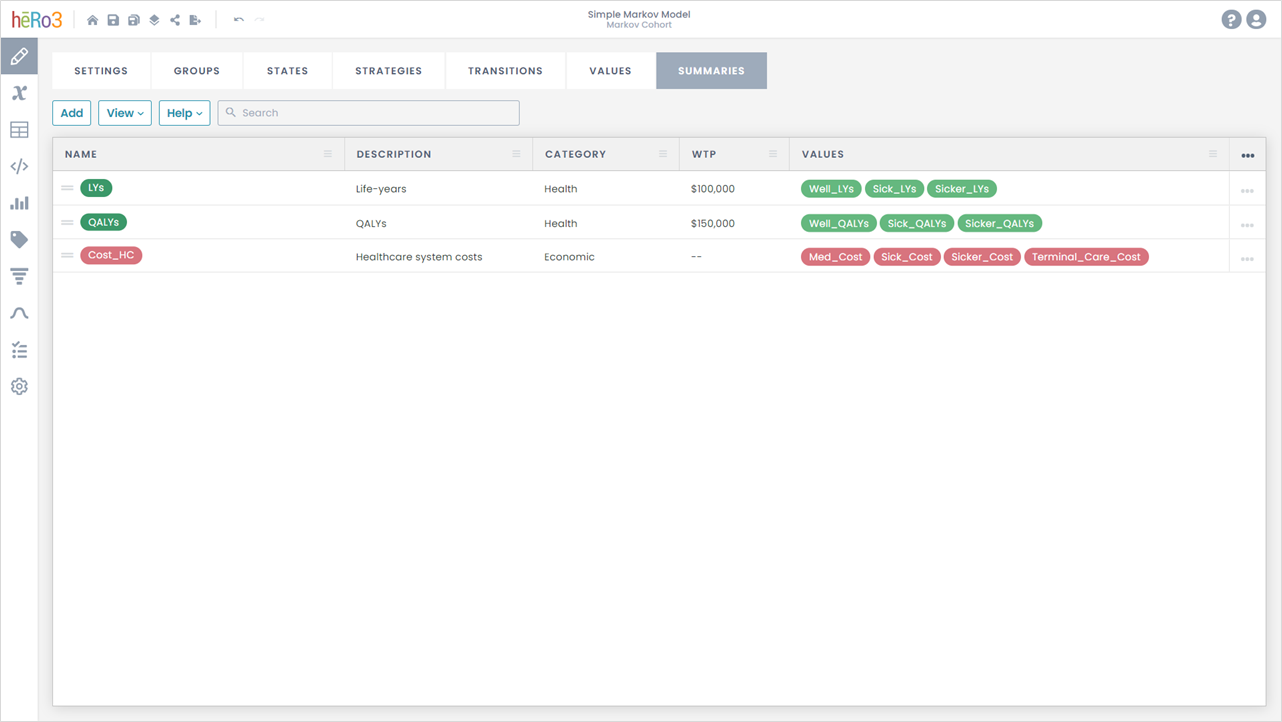
Summaries
The seventh and final stop on the hēRo3 Subway in the hēRo3 Model Editor is the Summaries page. Summaries allow you to define the aggregate measures of outcomes and costs that you want to include in your model. As with values, summaries may be categorized as either health summaries or economic summaries.
Health summaries aggregate outcome measures that you want to include in your final tallies of model outcomes, and economic summaries represent components of total cost that you want to use in your model. Each health summary is a health outcome that you can display as a separate result of your model; you also can use any health summary as a denominator in a cost-effectiveness ratio. Each economic summary is an aggregate measure of cost that can be displayed as a separate result of your model; you also can use any economic summary as the numerator in a cost-effectiveness ratio.
In this particular model, we want to define health summaries for life-years and QALYs. First, we need to add a summary, using the ‘Add’ button. For each such measure, we need to designate a name, categorize this value as a ‘Health’ summary, and select the set of health values that together comprise it. For example, in this particular model, we have given total life-years the name ‘LYs’, we have selected ‘Health’, we have assigned it an initial willingness-to-pay value of $100,000 per life-year saved, and we have specified that it is equal to the sum of ‘Well_LYs’, ‘Sick_Lys’, and ‘Sicker_LYs’ (the health values that we earlier defined that tallied life-years in the ‘Well’ and ‘Sick’ states).
Similarly, we want to define a summary (or summaries) for our costs. For our model, we will define a single economic summary, ‘Cost_HC’, which is the sum of ‘Med_Cost’, ‘Sick_Cost’, ‘Sicker_Cost’, and ‘Terminal_Care_Cost’.
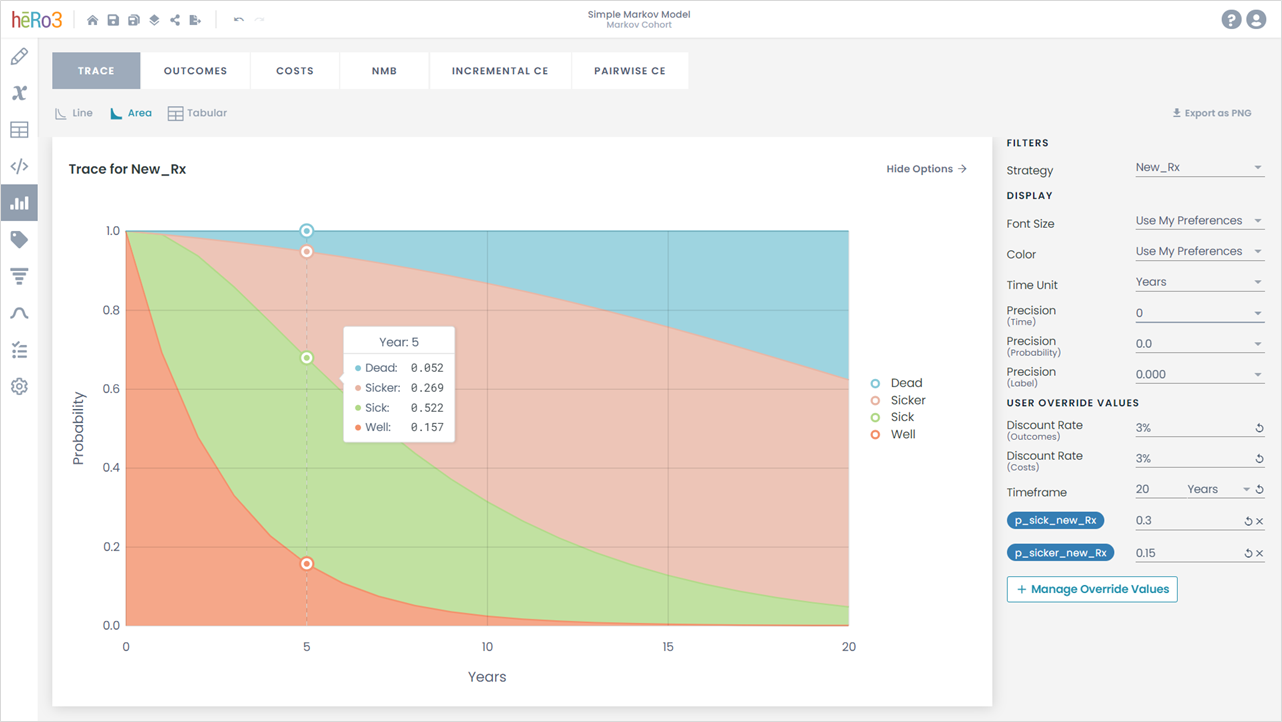
Results & Sensitivity Analyses
Now that we have completed all of the steps required to build a Markov cohort model in hēRo3, we can go to the base case results page and see the output from our model. We can also set up deterministic sensitivity analyses, probabilistic sensitivity analyses, scenario analyses, and solve for a value-based price. When a model fails to run, a red error message will be displayed at the bottom of the screen. A list of common error messages and what they mean can be found here.